|
<< Click to Display Table of Contents >> I/V curves of one MPPT input |
  
|
|
<< Click to Display Table of Contents >> I/V curves of one MPPT input |
|
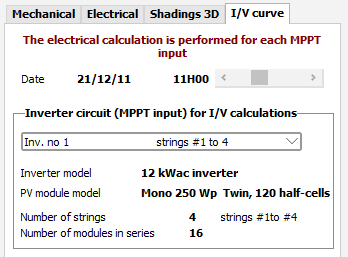
This is a pedagogic tool, which shows the full I/V curves of a complete sub-array connected to one MPPT input.
After performing the shadings animation you can view the I/V curves combination, for any chosen hour and MPPT input.
This may be rather complex.
The example here shows the situation of the previous page, using Twin-half-cut cells modules, and involving 4 strings on one table.
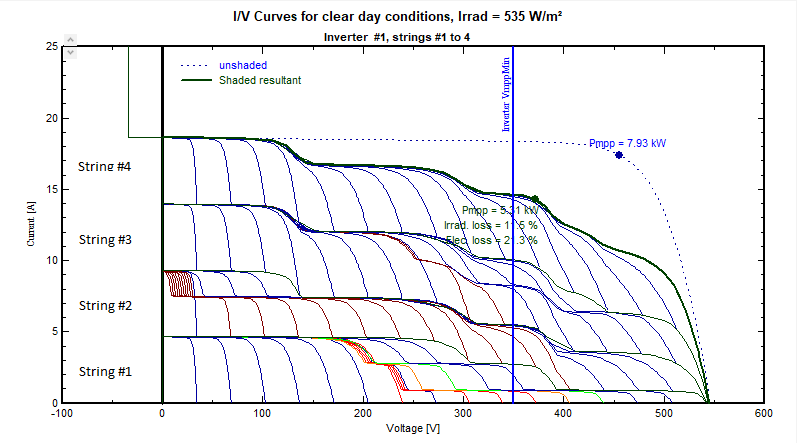
Each string I/V curve is obtained by addition of the voltages of each module.
We can recognize the 4 strings in parallel (string#1 and #2 splitted due to Twin modules), by addition of currents.
We see the effect of the roof shading on the first string (red sub.modules), and the rectangular object shade on the lower part of modules on the second string (brown on the left). The shaded sub-modules are inactive for the beam component, they are reverse-biased (i.e. the by-pass diode is activated).
The low-current submodules on the first string high voltages correspond to the effect of the remaining diffuse part, when the voltage has been reduced by the shades on the beam component (i.e. the activation of the By-pass diodes).
Shading factor calculation
The objective of this construction is to obtain the resulting I/V curve of the array.
The inverter will choose the Maximum power point on this curve. If the Maximum Power Point voltage is below the inverter's minimum voltage for MPP tracking, the operating point will be clipped to this value (or fixed on an eventual secondary Pmpp, whatever the higher power).