View Existing Scan
The optimization viewer displays the results of the parametric scans performed with the 'Optimization tool'.
It helps in quickly identifying the optimal values of the parameters for a given simulation variable.
Scan Selection
The top left part in the tab gives an overview of the scans that have already been performed.
From the drop-down list on the left, a scan can be selected by its title. The parameter ranges that were used for the selected scan are displayed in five columns below the name.
The parametric scans are specific for each variant of the project, this is why the list will only display scans that have been performed for the current variant.
There is the possibility to remove the selected scan from the list by clicking on the Delete Scan button. A message will pop up, asking to confirm the deletion of the scan.
The left part of the viewer allows to specify the parameters and plot options. The variable that is plotted can be chosen from a list on the top, next to the title of the plot. The plot itself is the square area, containing axes, the curve or color map and a legend in case of a two-dimensional plot.
Result Variable
During the simulation, several variables are computed for the final and intermediate results. The following variables are stored in the optimization scans and can be selected from the variable list:
- GlobInc: Global incident irradiance, also known as Plane of Array (PoA) irradiance in kWh/m2
- GlobEff: Global effective irradiance
- EArray: Effective energy at the array output
- E_Grid: Energy injected into the grid in kWh
By default the E_Grid is selected for display.
Plot Type
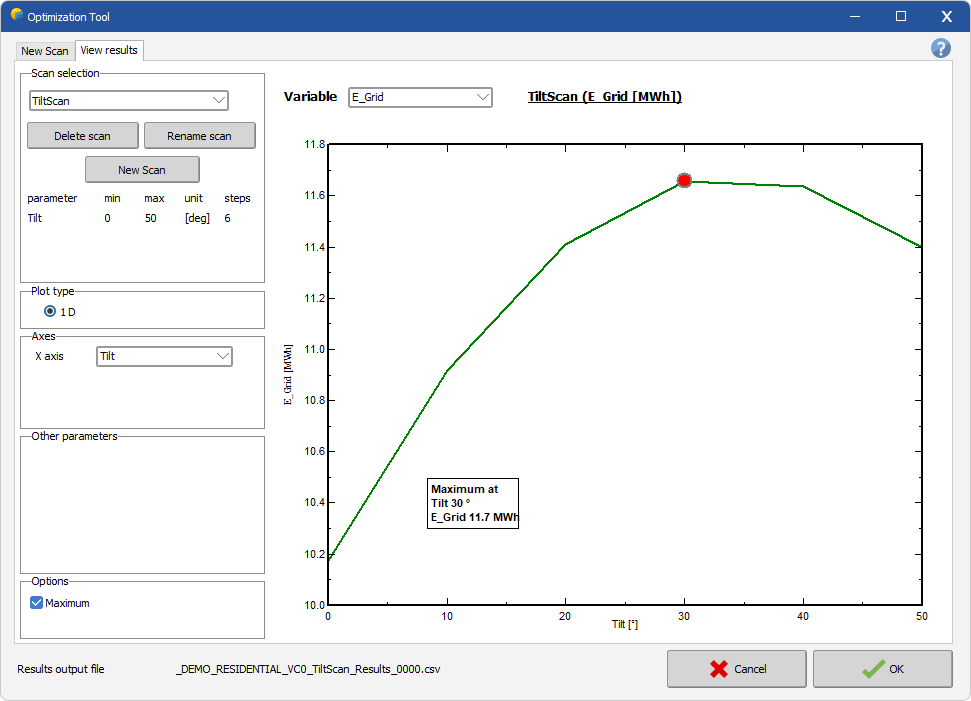
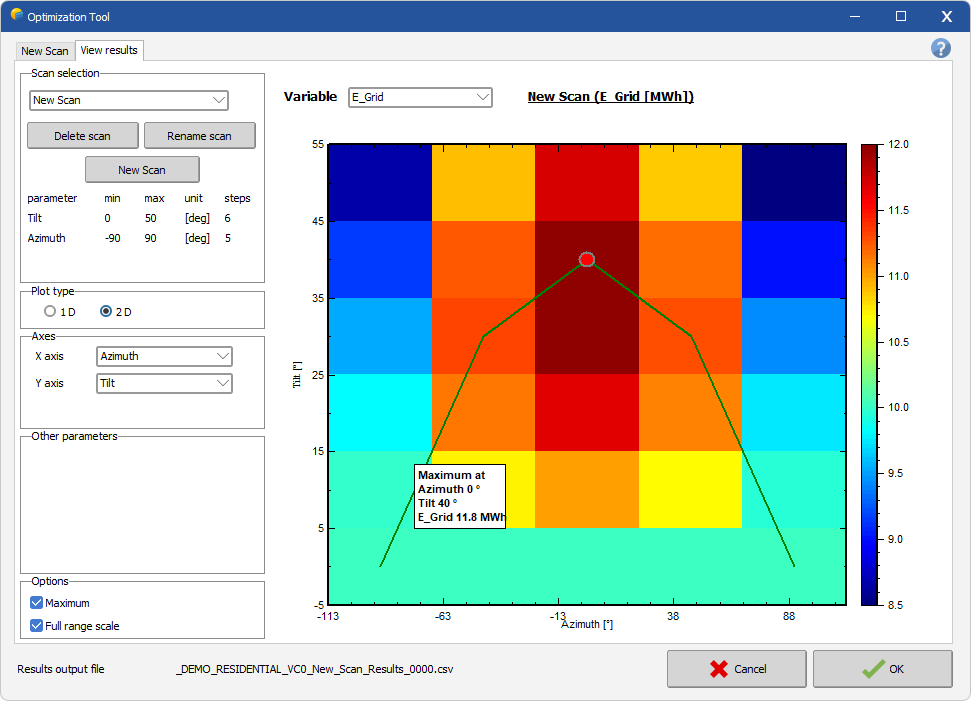
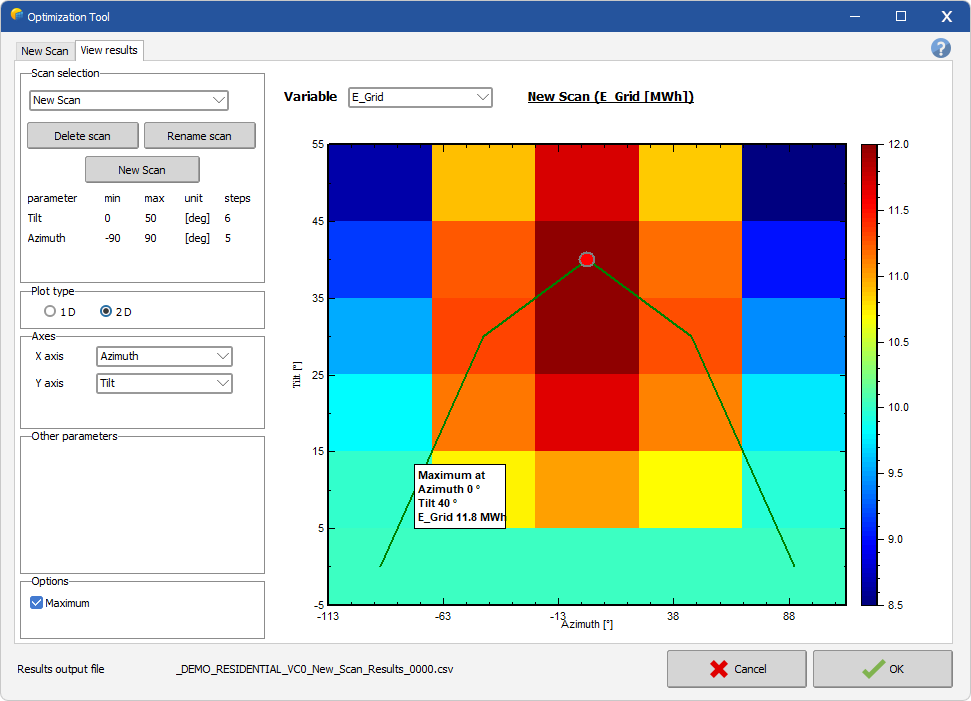
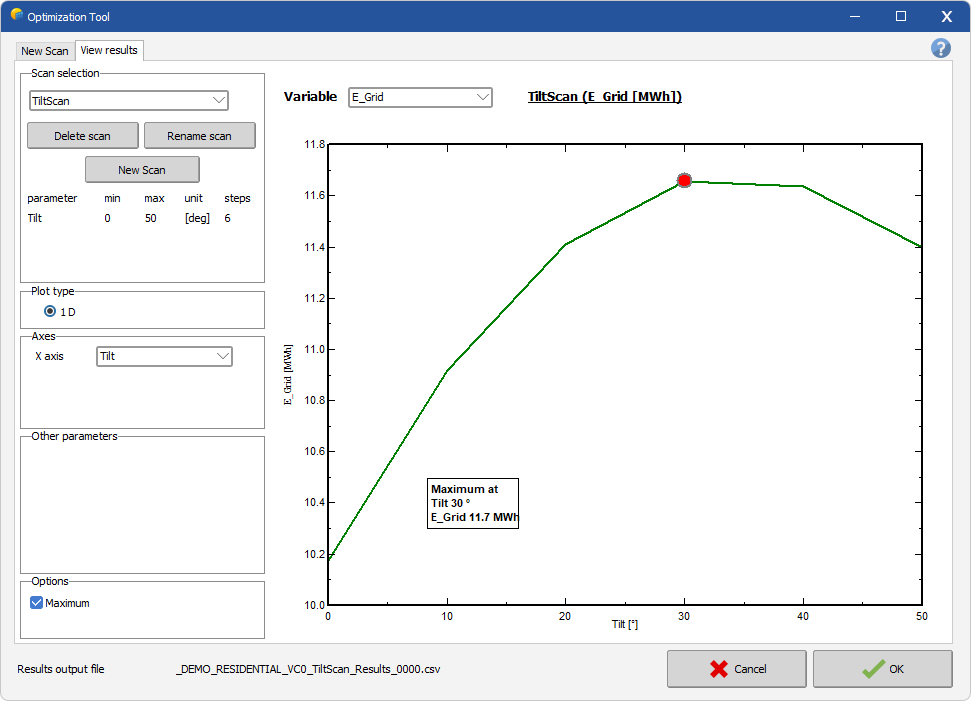
The results can be displayed either in a one- or a two-dimensional plot. The 1D-version is a curve of the result variable as function of one of the parameters. The 2D-version is only available, if two or more parameters were scanned. It consists of a colored surface with one parameter on each axis and the variable value being color-coded. The color code ranges from dark blue for small values to dark red for high values.
 |
| 1-Dimensional Plot |
 |
| 2-Dimensional Plot |
Axes
In this group the axes are associated to parameters that were varied in the scan. In a one-dimensional plot, only one parameter for the X-axis needs to be chosen, for two-dimensional plots, parameters have to be associated to both, the X- and the Y-axis.
Non-displayed parameters
If more than one parameter was varied within a scan, it can happen, that one or more parameters are not associated to any of the axes. These are the 'non-displayed parameters'. In this case, a field with a spin button and a slide bar will appear in this group for each non-displayed parameter. These controls allow to set a value for this parameters, and the plot will be updated accordingly.
Additional options
The additional options control some details in the plot region.
- Maximum: If this option is checked, the maximum value in the plot will be marked with a red dot, and its values of the parameters and variable will be displayed in a text box
- Full Range Scale: If this option is checked, the range of the scale for the variable will be chosen so that it covers all values from the scan. Changing the non-displayed parameters will have no effect on the displayed variable range. If on the other hand this option is unchecked, the range of the Y-axis for 1D plots and the range of the color code for 2D-plots will adapt to best cover the values that are actually displayed. Changing the values of the non-displayed parameters will now change these ranges.

