Transposition factor optimizing tool
The Transposition Factor is the ratio of the incident irradiation on the plane, to the horizontal irradiation. It represents the irradiance losses or gains when tilting the collector plane compared to the horizontal plan.
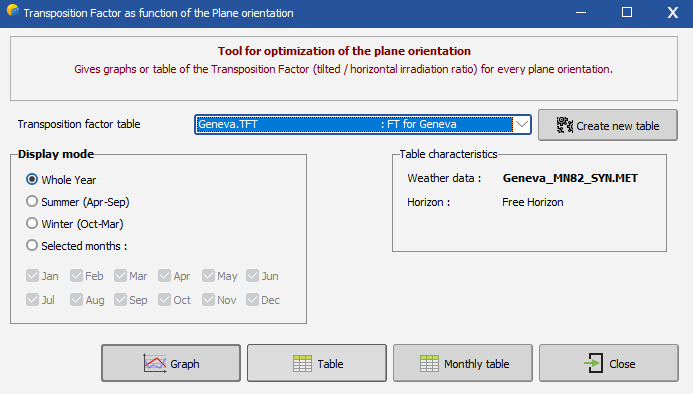
In Tools => Transposition factor, you have a complete calculation of the transposition factor, for all plane directions using any hourly weather data.
Data set creation
First, you have to create a table of monthly values for a combination of tilts and azimuths. Choose the weather data, using either hourly or monthly values, from which PVsyst will elaborate a synthetic hourly data file. Then select the scale and resolution of this table (min, max and step for azimuth, step for the tilt). It is also possible to include an horizon line for taking potential far shadings into account by clicking on Horizon. Setting the horizon line will usually result in an azimuth displacement.
Once setup, click on Generate to run the computation. The results will be stored in a file *.TFT, stored in the meteo folder of your working copy.
NB: When using hourly measured data, the optimal azimuth may be displaced because specific weather data behaviors like frequent fogs in the morning, storms in the evening, etc.
Results
Once the data as been generated, it becomes available for selection in the main menu.
Please note that the orientation optimization depends on the targeted use for the PV energy.
- For grid-connected systems, the energy is usually sold at a constant price all over the year. The relevant optimum is then to maximize the yearly energy.
- For stand-alone systems, the relevant solar yield for sizing the system may be, for example, the winter months for a house or industrial system; or some specific months for leisure appliances.
- For pumping systems, it may depend on the final use of the water pumped: household (all over the year) or irrigation (some specific seasons or months).
Therefore this tool gives the opportunity of choosing the optimizing period: Year, Winter, Summer, or chosen months. 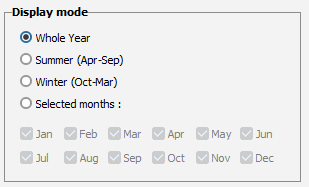
Once the right mode selected, it is possible to display the data as a graph or tables.
Results as a graph
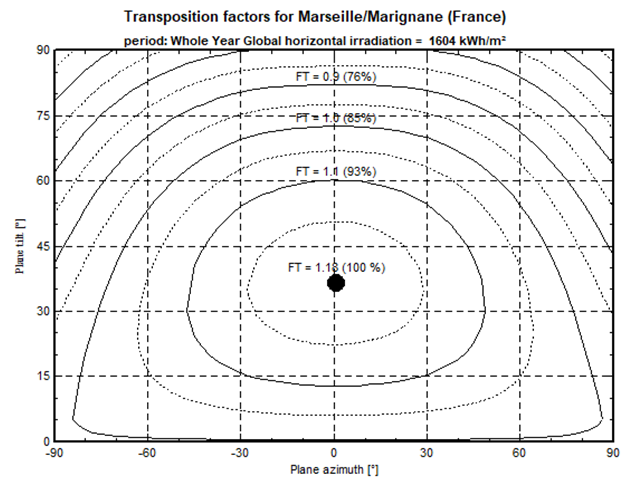
The main result is a plot of iso-transposition lines function of the plane azimuth and tilt. Each curve is also labeled with the amount you loose with respect to the optimal orientation.
Summer optimization usually has a flat optimum: Azimuths changes have a very low impact on the produced energy, especially when the tilt is low. This let important freedom for positioning the arrays. 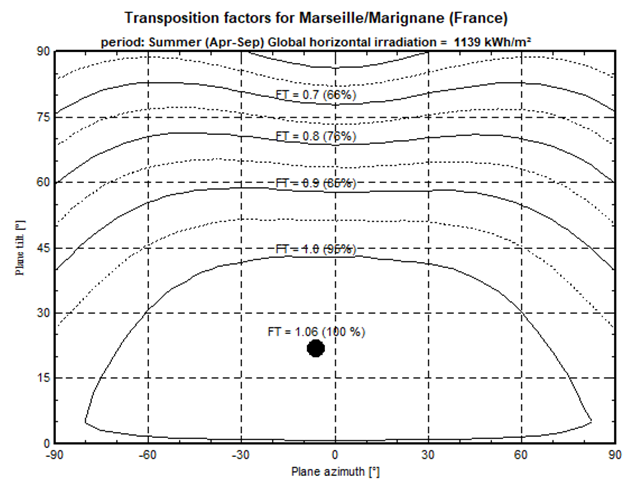
As a contrary during the winter months, the yield is much more sensitive to the plane orientation, with important gradients around the maximal point. Iso-transposition curves are closer to each other, leading to less freedom for a good orientation. 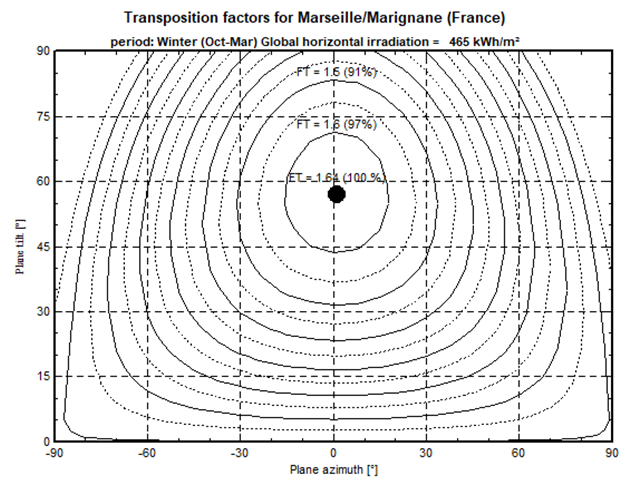
Results as tables
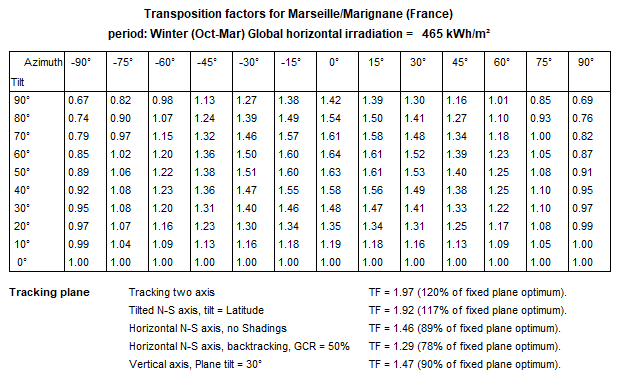
These results may also be obtained in the form of tables, either for the chosen period, or as monthly values.
The table includes the gains you can expect from usual tracking systems.
