Grid inverters - Efficiency curve
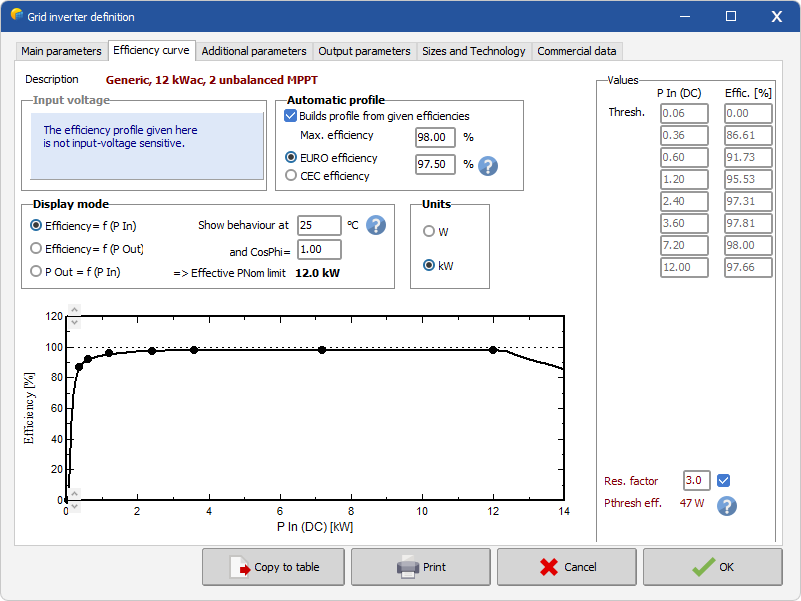
The inverter's efficiency is characterized by a power transfer function during normal operation, depending on the instantaneous power.
This transfer is usually given in terms of efficiency as function either of the input or of the output power. That is, it is represented by a non-linear curve, with a threshold input power which may be understood as the inverter's own consumption.
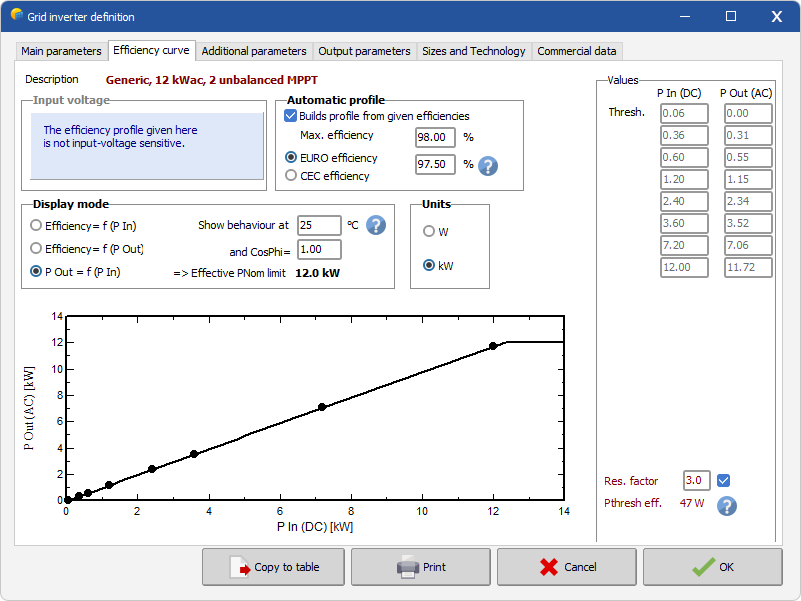
However, it may be more convenient to transform this curve into an input/output power characteristic: the behavior then becomes practically linear, with a pseudo-straight line cutting the abscissa at the working power threshold. The efficiency elbow at low powers is for a great part due to the mathematical transformation of this threshold. Inverter manufacturers try to improve the efficiency at low powers, giving rise to a hardly visible improvement on the beginning of the straight line (when represented as Input/Output graph).
The ohmic effect of the output circuits (transistors and transfo) induces a loss which increases quadratically with the current (or power), leading to a decrease of efficiency after a maximum.
Defining the efficiency curve
The efficiency curve is rarely explicitly given by the manufacturers. For some inverters the database gives the efficiency curve measured by independent institutes.
The program offers the possibility of entering a profile characterized by at most eight points, for up to 3 input voltages (Pout = f(PIn), or Efficiency as a function of Pout or Pin). Points may be entered by edition or mouse displacement. See also the inverter model: efficiency page.
Interpretation of the efficiency curve
- Up to the power threshold (often named "Starting operating at ..." in datasheets), the input power corresponds to internal consumption for the internal needs of the device, and doesn't produce power.
- From this threshold, the device is supposed to produce an AC power proportionally to (Pin - PThresh). This production is penalized by an ohmic loss of the internal components (transformer and transistors), which increases quadratically with power (like R · I²). When translated into efficiency, this gives a maximum efficiency usually around 50-60% of the nominal power.
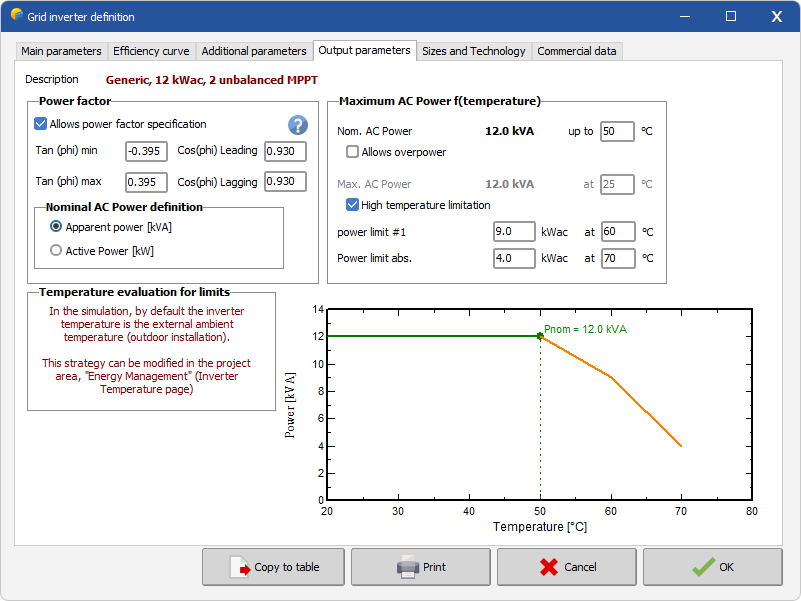
- POut limitation starts when the inverter nominal power is reached. This limit may depend on the temperature and on the power factor, as explained in the "Grid inverters - Output parameters section". The user has the possibility to challenge (T°C, PF) combinations to see what is the limit and to understand what the simulation will do in practice.
- Beyond the limit, the Efficiency=f(P In) mode shows a decrease of efficiency. This can be explained in the following way: whatever the input power, the output power remains the same and so, mathematically, the ratio POut/PIn drops.
A practical example is given below, for 12kVA generic inverter showing an overpower behaviour with an apparent power limitation. If such an inverter operates at 35°C, its Pout limitation will be 13.2 kVA, so 13.2 kWac with a power factor of 1. With a power factor of 0.9, the maximum active output power would drop to 11.88 kWwac. The limitation would start at (Pin, Pout,Efficiency) = (12.166 kW,11.880 kW, 97.66%).
This is more easy to understand with the POut=f(P In) mode :


